
Why can't we find what healthcare really costs?
I blended the public data so you can do a better job of it. The Price Atlas, the Price Shopper and the new Health Price Studio are now part of Techy Surgeon.
I have operated on patients who had no idea what the operation would cost until the bill arrived. Not because anyone hid it well. Because the price of a single procedure lives in five places at once, each written in a different dialect: a Medicare fee schedule, a hospital chargemaster, an insurer contract, a surgery center's rate, and whatever the patient is finally asked to pay.
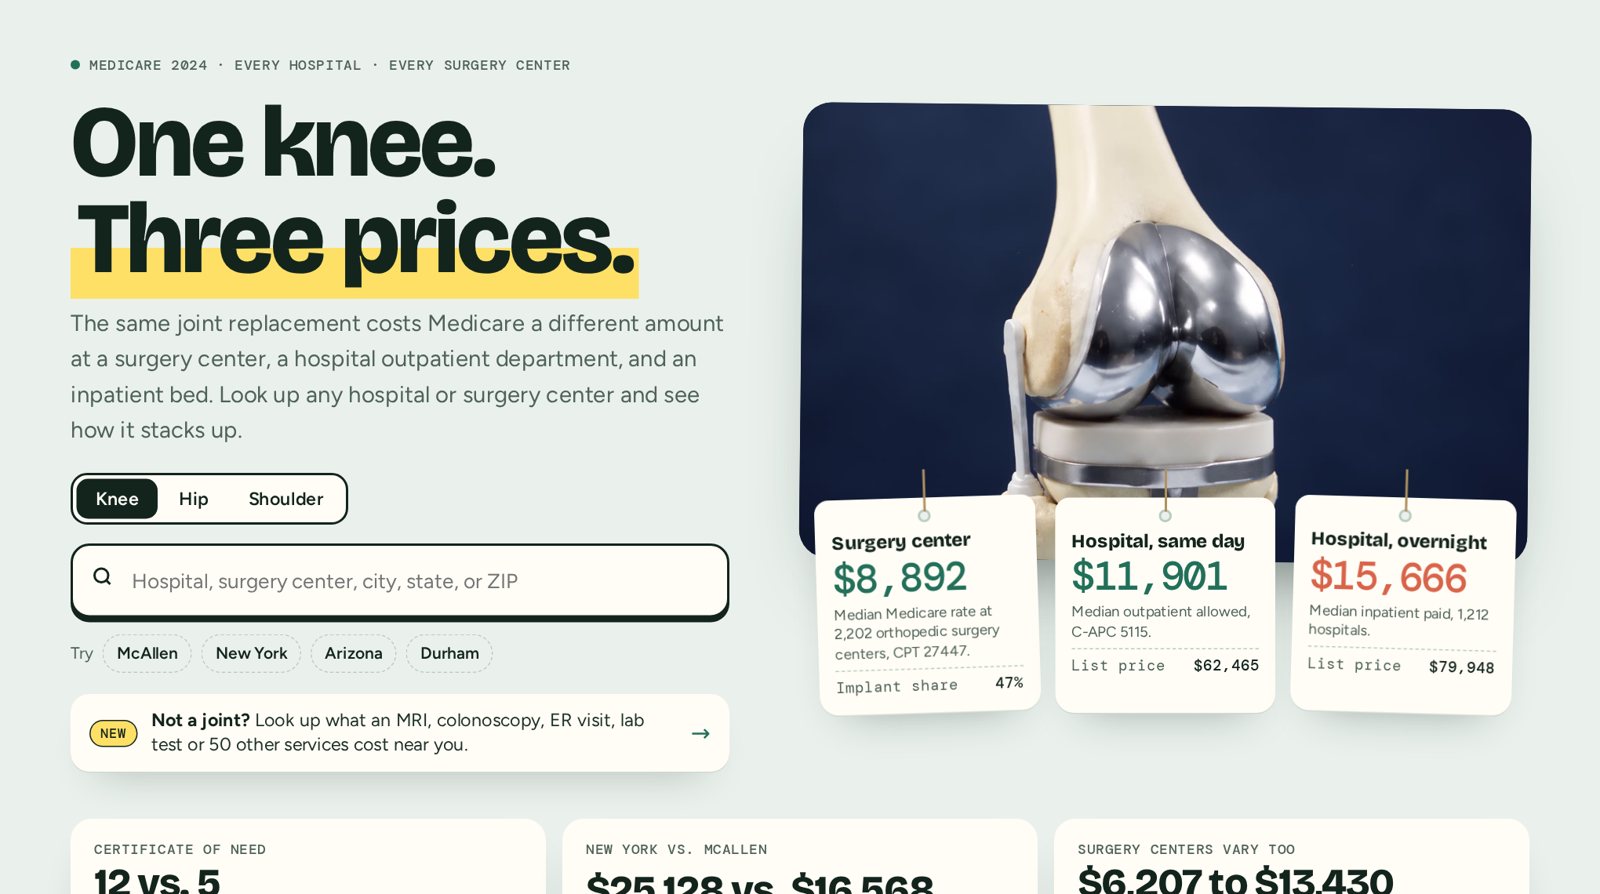
Take one knee replacement. Same implant, often the same surgeon, sometimes the same week. In 2024, Medicare paid a median of:
Four numbers for one operation, and none of them is what a commercially insured patient pays. The building sets the price far more than the knee does.
The rules exist. The files are unreadable.
Hospitals have had to publish their negotiated rates since 2021; insurers since 2022; and since January 2026, hospitals must post what they were actually paid. That is real progress. But the files run to gigabytes, use inconsistent formats, and were written for machines. A September 2026 review by PatientRightsAdvocate found about half of hospitals compliant, and fewer than one in five posting enough dollar prices to compare. The information is public in the way a library in a locked basement is public.
So I built the thing I wanted, both as a surgeon and as someone who will one day be the patient.
What's live today
- The Price Atlas. Every U.S. hospital and every certified surgery center: what Medicare paid for knee, hip and shoulder replacement, the posted list price, Care Compare quality, and the nearest cheaper alternatives. Search any hospital, city or ZIP.
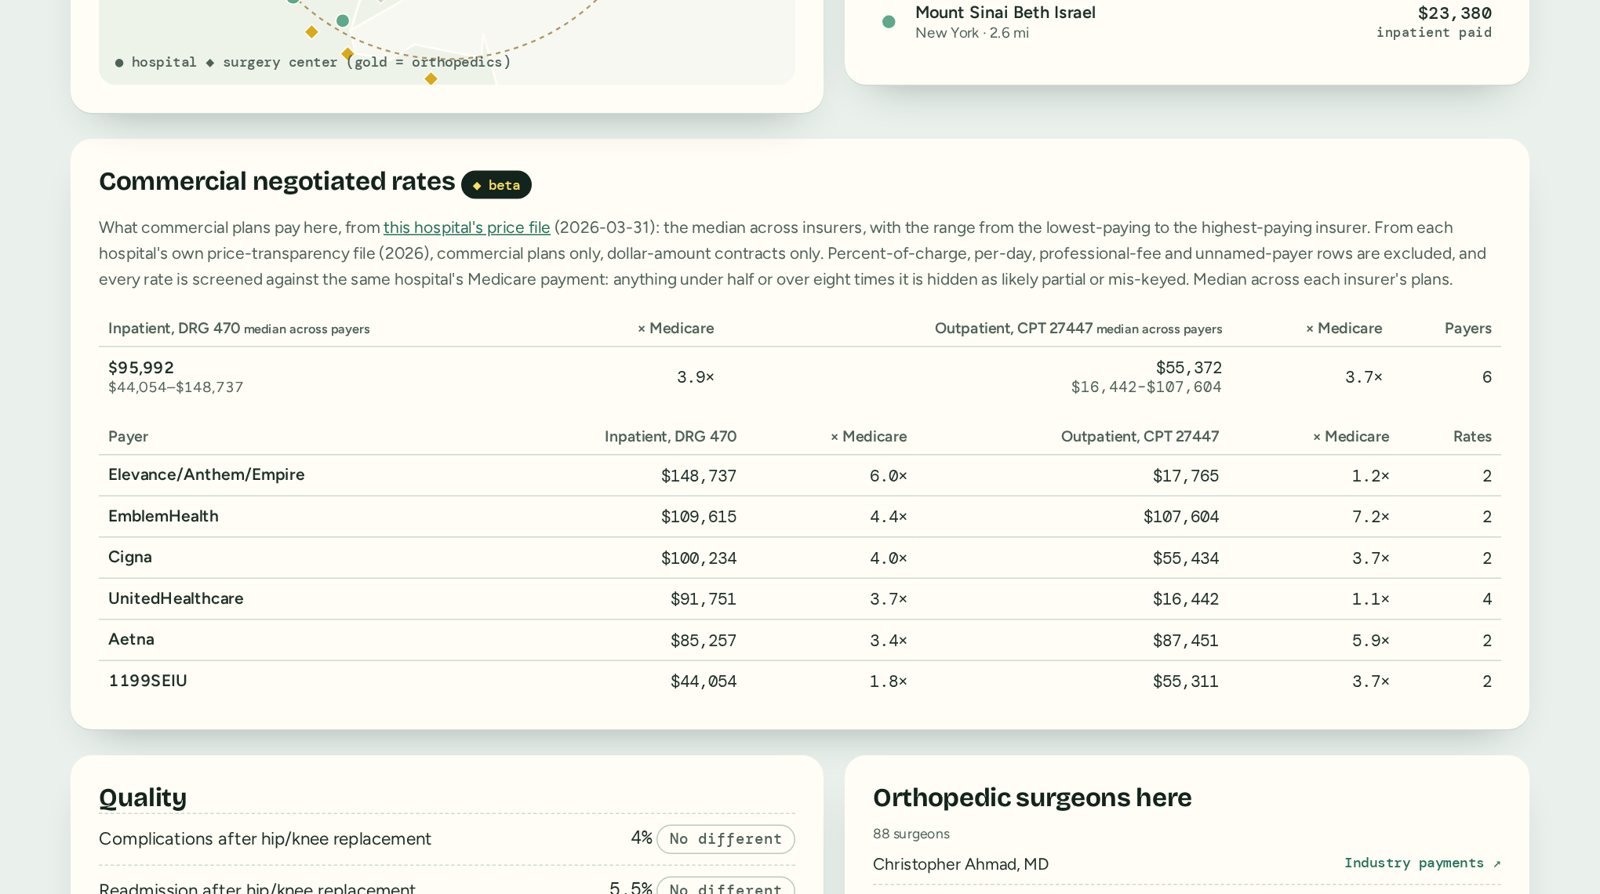
- What insurers actually negotiate. Rates by insurer at 62 hospitals in seven markets (the Rio Grande Valley, New York City, the Research Triangle, Nashville, Phoenix, Chicago and Atlanta), read from each hospital's own 2026 price file and screened line by line against that hospital's Medicare payment. Across 49 of those hospitals, the median commercial rate for a hip or knee stay comes out at about twice what Medicare paid the same hospital.
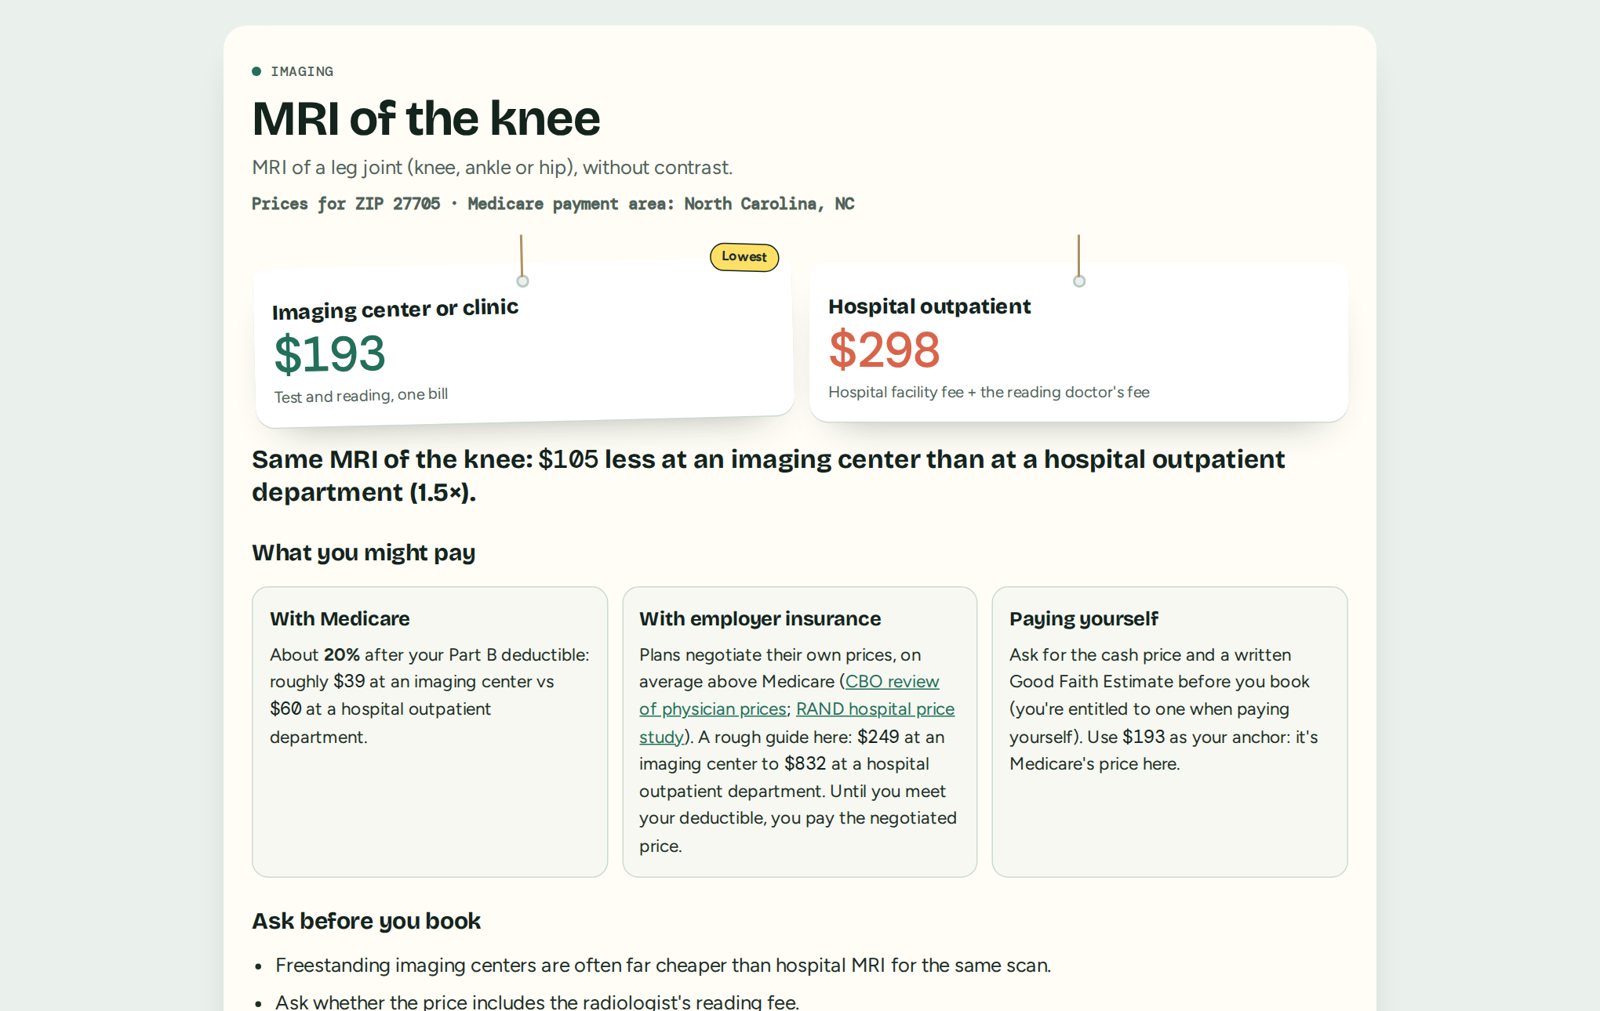
- The Price Shopper. Fifty-four common services, from an MRI or a colonoscopy to an ER visit or a lab panel, priced for your ZIP code in every setting, with a calm, plain-English guide to reading a quote or a bill.
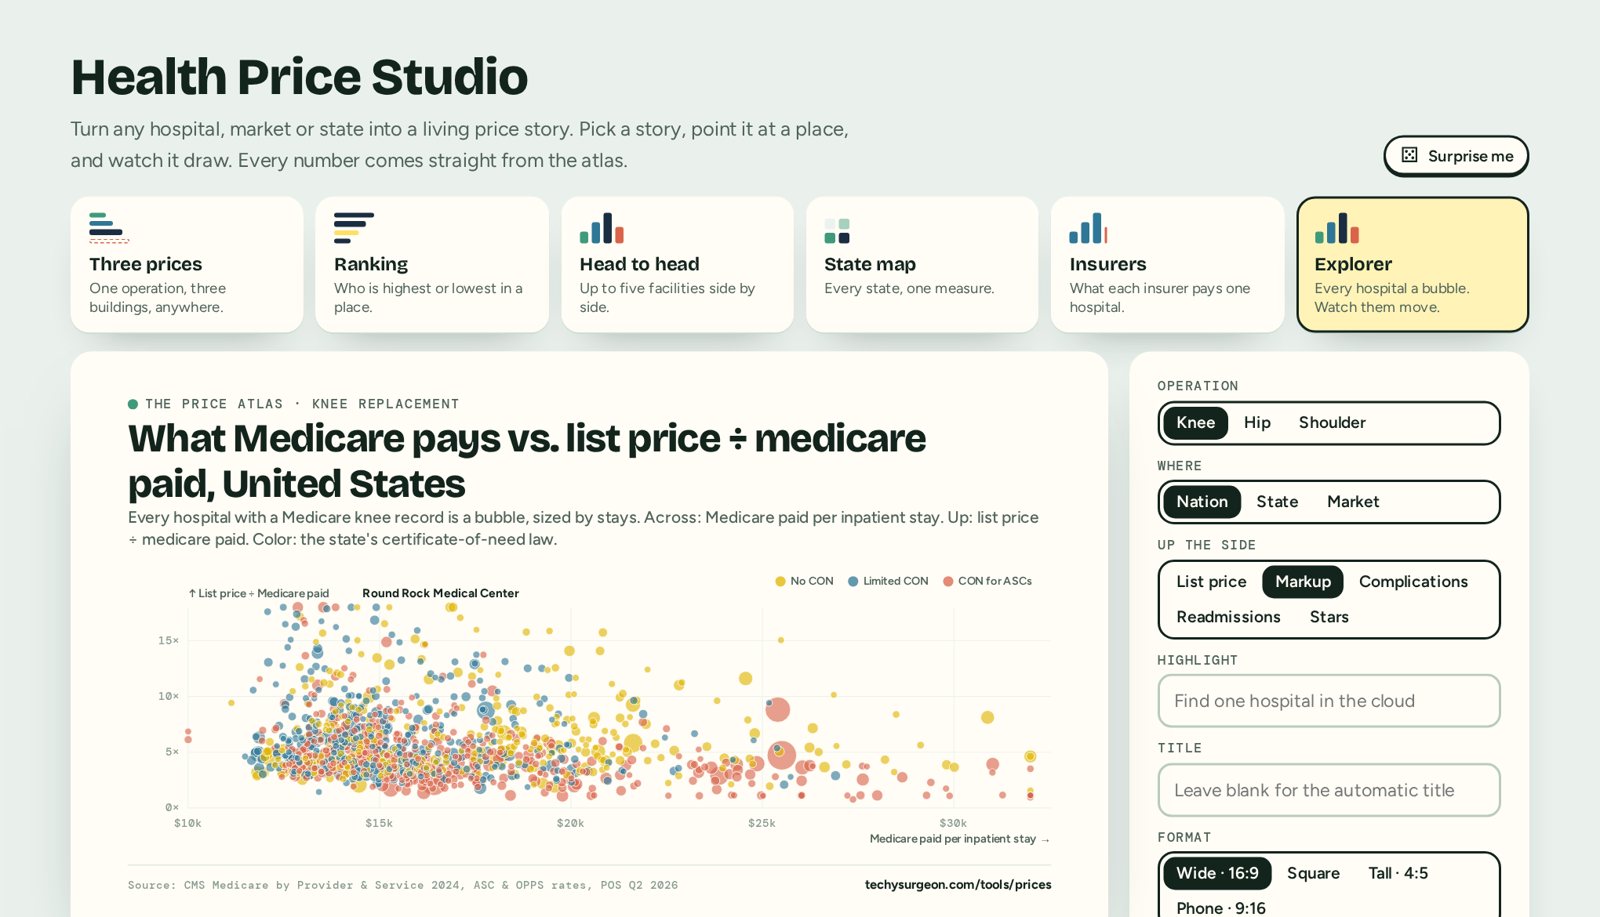
- The Health Price Studio. Turn any of it into a living chart: a place's three prices, a ranking, a head-to-head, a state map, an insurer comparison, or the Explorer, where every hospital in America is a bubble.
- Ask AI. Ask a question in plain English. Claude writes one checked query, your browser runs it against the data, and you see the query and its assumptions. It never makes up a number.
Try it right here
This chart is live, not a picture. Hover over any bubble (or tap one on your phone) to see the hospital. Every dot is a hospital; up the side is how many times Medicare its list price is.
How you can trust it
Every number shows its source and date. The Method page lists every dataset, every formula and a live set of data checks; 80 of 80 random values matched CMS's own lookup tools at the last build. Commercial rates pass a published screen: dollar contracts only, no professional-fee or per-day rows, no unnamed payers, and nothing under half or over eight times the hospital's own Medicare payment. And every Monday an automated review checks all of the Techy Surgeon data tools, from pages and files to counts, freshness and gates.
What it is not: a quote. Medicare is the anchor because it is the one price published everywhere; your plan, your deductible and the surgeon's and anesthesiologist's separate bills will change what you pay. Use it to ask better questions before you book.
Part of Techy Surgeon, with more for Founding members
Everything above is free to explore. Founding members ($390 a year) get the tools to work with it, across every Techy Surgeon data platform:
- Live chart embeds for your newsletter, deck or website, and interactive chart files that work offline.
- Exports: the data behind every chart, table and report, as CSV.
- 100 Ask AI questions an hour, instead of 20.
- The same depth in the CJR-X Engine (now with every TEAM hospital), the ASC Market Map, the ACCESS and ASM tools, and the Open Payments Atlas.
Founding is what keeps the public side free: the quarterly refreshes, the new markets, the checks.
The price of care shouldn't be a mystery to the people who provide it or the people who receive it. Start with the building you'd walk into.
Christian
Sources: CMS Medicare Inpatient and Outpatient Hospitals by Provider and Service (data year 2024); CMS ASC and OPPS payment rates (July 2026); Provider of Services file (Q2 2026); Care Compare (2026 release); hospital price-transparency files (2026); PatientRightsAdvocate semi-annual compliance report (September 2026). Educational only; not medical, legal or billing advice. I also co-founded RevelAi Health; it has no role in these tools.